Following the flood of 1997, the Province of Manitoba commissioned the collection of elevation data across the Red River flood plain using LIDAR technology. It has since added many other regions across the Red River Valley and Southern Manitoba. LIDAR is short for Light Detection and Ranging and without going into detail, it is elevation data collected by plane. The Red River dataset claims a vertical accuracy of about 6″. In comparison, RTK systems used for drainage typically claim a vertical accuracy of less than 1″.
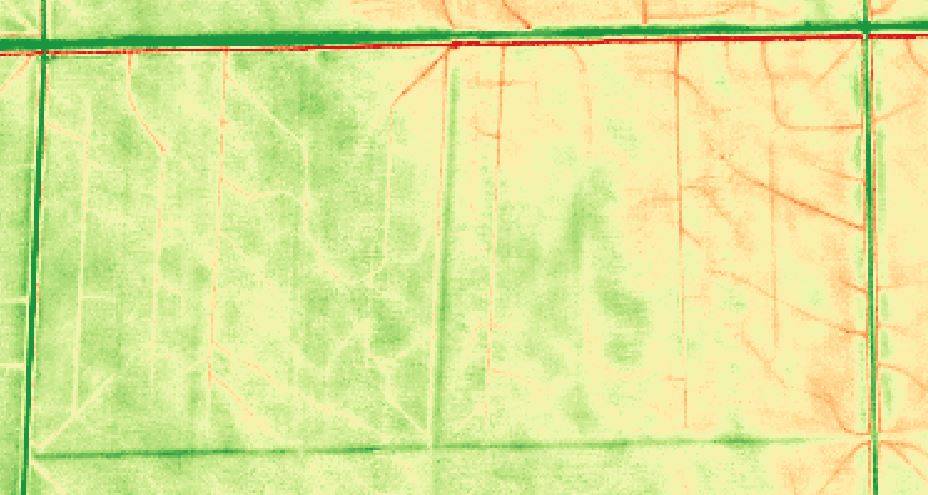
Fig.1 LIDAR Image of a field in the Red River Valley
So how does LIDAR with 6″ accuracy help you with drainage?
First off, it lets you see the big picture. In the Red River Valley floodplain where I grew up, it is not uncommon to see topography changes of less than 3 feet on the mile. It is sometimes tough to see the natural direction that water wants to flow (if it wants to flow at all). Before modern roads and drains were built, this land must have been quite the swamp. Because of all the roads and drains, water may no longer take a natural path to the nearest river.
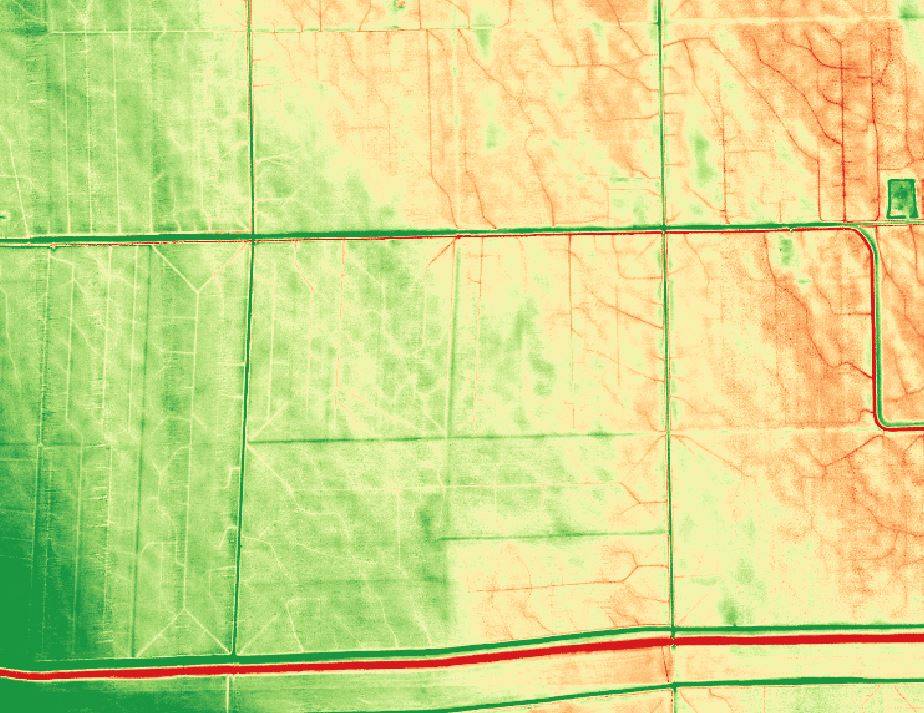
Figure 2. Same LIDAR dataset showing surrounding areas
Because the LIDAR data encompasses large regions, we can zoom out (Fig. 2) and look at the surrounding area. This is especially useful when renting or buying new land. We can look at it and see which direction makes the most sense to send water.
The next benefit to using a LIDAR or RTK survey is watershed modeling. Many drainage software packages allow you to map out the depression areas that potentially hold water back. As you can see in the examples below, a proper RTK survey will give a truer picture because it includes an accurate survey of existing drains at sub inch accuracy (Fig. 3) vs LIDAR (Fig. 4) at six inches.
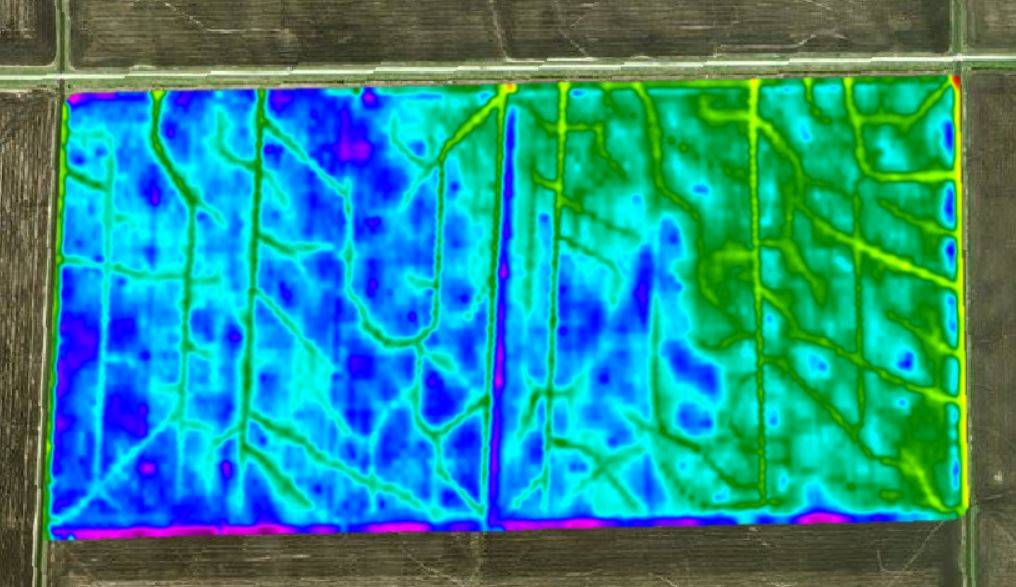
Fig. 3 RTK Elevation Survey Data. < 1″ vertical accuracy. There is approximately 3ft of elevation difference in this particular field.
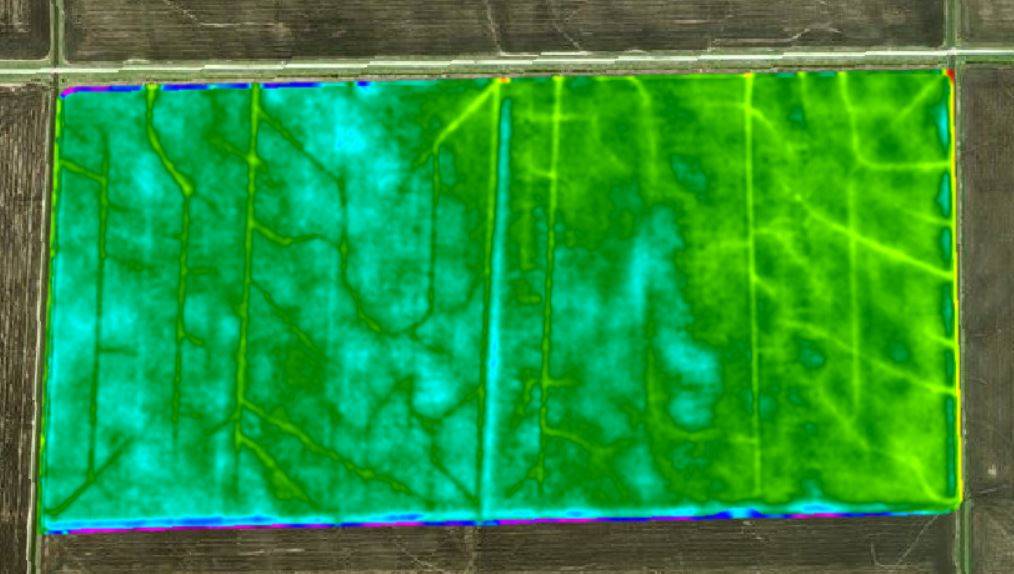
Fig.4 LIDAR elevation survey. 6″ vertical accuracy
Below are the depression maps based off the above surveys.
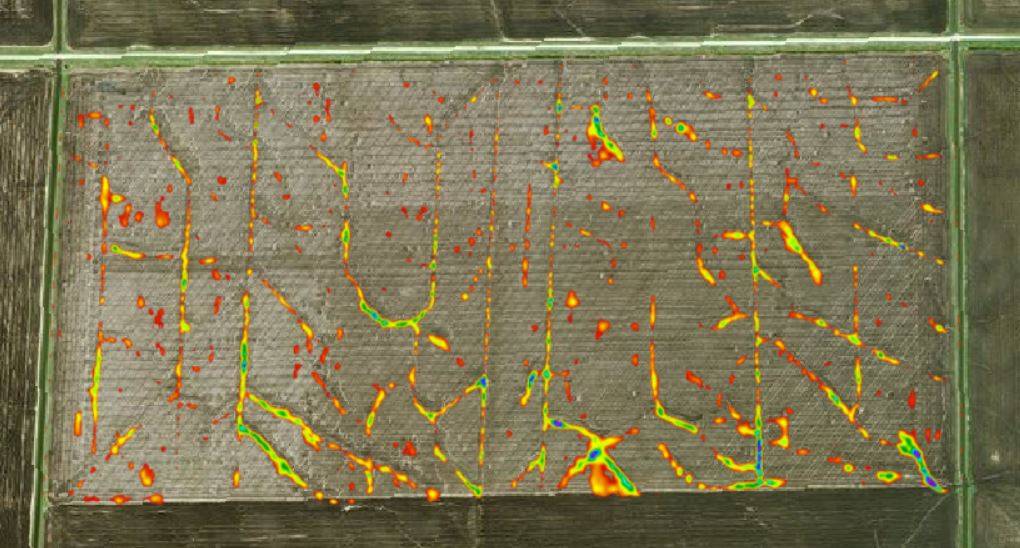
Fig. 5 RTK based depression map
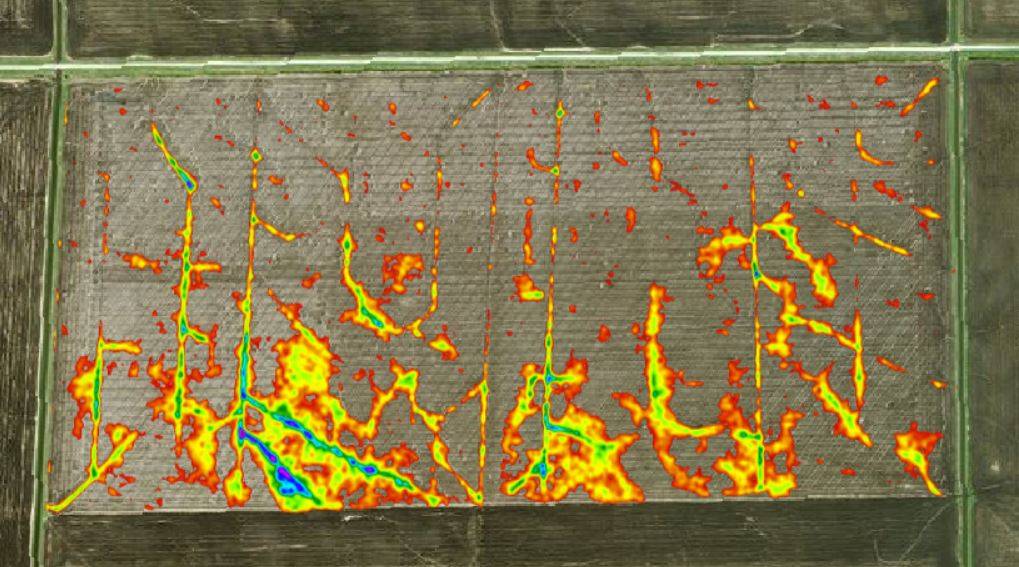
Fig. LIDAR based depression map. Larger problem areas likely due to the lower accuracy.
Although problem areas appear to be more severe using LIDAR, they are very similar and LIDAR has the advantage of being readily available to producers. Another option is to use NDVI imagery from a wet year such as 2016. The example below is a map derived from 10 meter Sentinel imagery taken late last summer (fig.7). It is important to consider crop type and maturity when choosing dates.
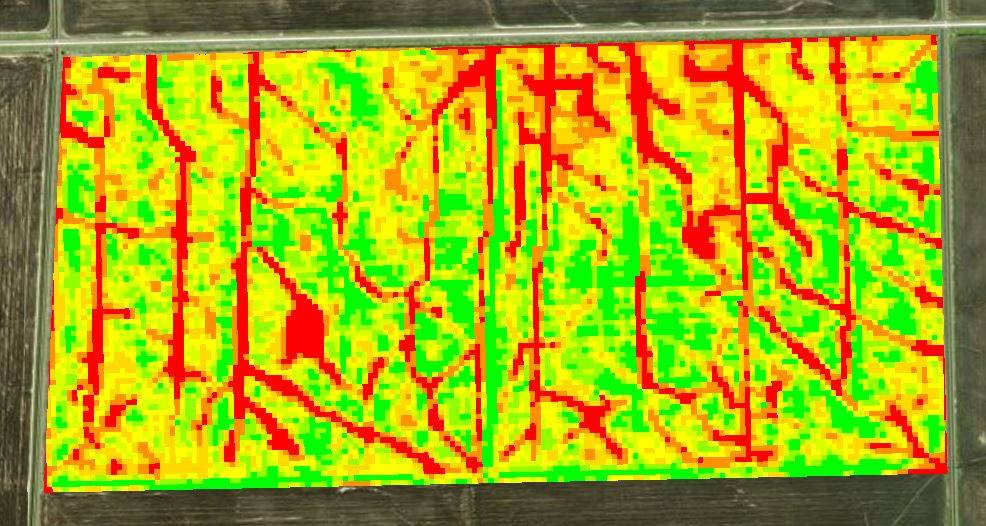
Fig. 7 NDVI imagery (10m resolution) measuring crop biomass in an extreme wet year (2016). Red areas had little to no vegetation and correlate very well with RTK and LIDAR.
Any of these maps can be loaded into a screen or tablet as a background layer so the operator can see exactly where he or she is on the field using a GPS. They can then target these problem areas with greater accuracy. This is especially important in dry years such as 2017 where depression areas are not readily visible.
As mentioned earlier, LIDAR and satellite data is currently available for most regions of the Red River Valley. Antara Agronomy provides full data management services to producers and can help you take your water management to another level using some of the above mentioned tools. Whether you have RTK data available or want to identify problem areas using other alternatives, we can help. Contact Antara today for more information.

