Phosphate Residual:
As part of our ongoing efforts to optimize fertilizer management, we’ve been closely tracking phosphate residuals in fields across the region. We have noted that phosphate residual levels were fairly consistent across most crops this fall with the exception of soybeans, which showed a slight dip of 2.5 ppm (about 5 lbs). While this decrease might seem minor, it’s raised some interesting questions about the role of soybeans in phosphate cycling and whether this trend is something we see repeating year after year.
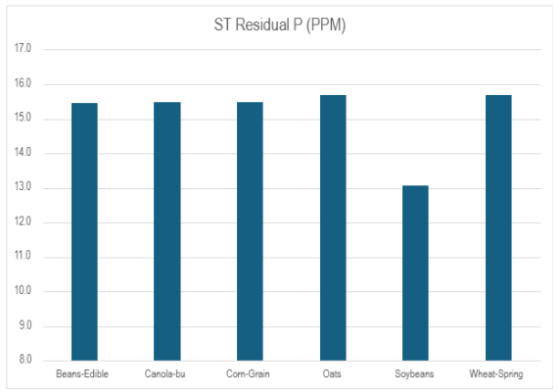
The Big Question: Why the Drop in Soybean Fields?
The drop in phosphate residuals for soybean fields raises two main questions:
- Is this a result of soybeans pulling high amounts of phosphate from the soil?
- Is the drop a result of farmers sometimes skipping phosphate applications ahead of soybeans because they don’t typically respond?
To answer these questions, we need to take a closer look at the data. This fall (2024), we sampled over 500 fields, and we’ve updated our analysis to provide a more comprehensive view of phosphate residuals. By using box plots to visualize the data, we can gain new insights into how phosphate levels vary across different crops.
Understanding Box Plots
For those who aren’t familiar with box plots, let’s break it down quickly. In the chart below, the X represents the mean (average) phosphate residual for each crop. The orange boxes indicate the spread of the middle 50% of fields sampled, and the whisker lines above and below the boxes represent the top and bottom 25% of the fields, respectively.
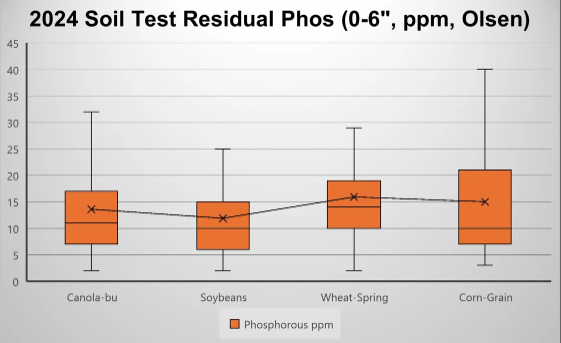
Looking at this data, we can see some interesting trends:
- Phosphate levels across most crops range between 5 and 15 ppm, but there are a significant number of fields testing at 20+ ppm.
- Manure history is a key factor for the higher phosphate levels. Fields that have a history of manure application often test above 15 ppm.
- Another factor affecting phosphate availability is soil pH. Soils with lower pH (e.g., in the high 6’s to low 7’s) tend to have more available phosphate. In contrast, soils with higher pH (like many found in the Red River Valley, which are often calcareous with pH levels closer to 8) may have phosphate that’s tied up and not readily available, even if it’s present in the soil.
Soybean Fields: Lower Residuals and a Narrower Range
When we zoom in on the soybean data, a clear pattern emerges: soybean fields tend to have lower phosphate residuals than fields planted with other crops. They also have a narrower range of phosphate levels compared to other crops, which indicates that soybean fields tend to be more consistent in their phosphate availability.
This brings us back to the original question—why are soybean fields testing lower? One possibility is that soybeans may not require as much phosphate as other crops, or they may not be as responsive to applied phosphorus fertilizer. This could explain why some farmers choose to skip phosphate applications before planting soybeans.
However, it’s also important to note that this trend doesn’t seem to be consistent year after year.
Year-to-Year Variability: A Closer Look at the Data
To understand whether this dip in soybean phosphate residuals is a repeatable trend, we compared this year’s data to the past two years. What we found is that the pattern doesn’t appear to be consistent across multiple years. In fact, the phosphate levels seem to fluctuate depending on the crop planted, which suggests that the levels may vary from one year to the next—likely due to crop rotations.
Does this suggest a typical 3-4 year rotation cycle? Possibly! But there’s another factor to consider: the fields we’re testing may change year to year. As our business grows and farmland changes hands, the dataset of fields tested will shift, meaning that the results could differ even if the broader trends remain the same.
Moving Forward: What’s Next?
To gain a clearer understanding of these trends, we plan to narrow down our dataset to compare only those fields that were tested consistently over the past three years. This could give us a better picture of long-term phosphate residual trends and allow us to assess whether there truly is a pattern emerging from crop rotations.
This is something we’ll be diving deeper into this winter as we analyze our Benchmarking Data, so stay tuned for updates!
Phosphate residuals are an important part of managing soil fertility, and understanding how different crops affect these levels is essential for making informed fertilizer decisions. While we’re still working through the data, early trends suggest that soybeans may behave differently than other crops in terms of phosphate uptake, but further analysis is needed to understand the full picture.
As always, we’re committed to providing the best agronomy advice based on data, so you can make the most informed decisions for your fields. If you have any questions or would like to discuss phosphate levels on your land, feel free to reach out!


